Table of Contents
Introduction: The “Uncanny Valley” of Business Data
By late 2024, the world had mastered AI art. We could generate cinematic astronauts, photorealistic landscapes, and anime characters in seconds. Tools like Midjourney and DALL-E became household names.
But for the business world, there was a glaring problem.
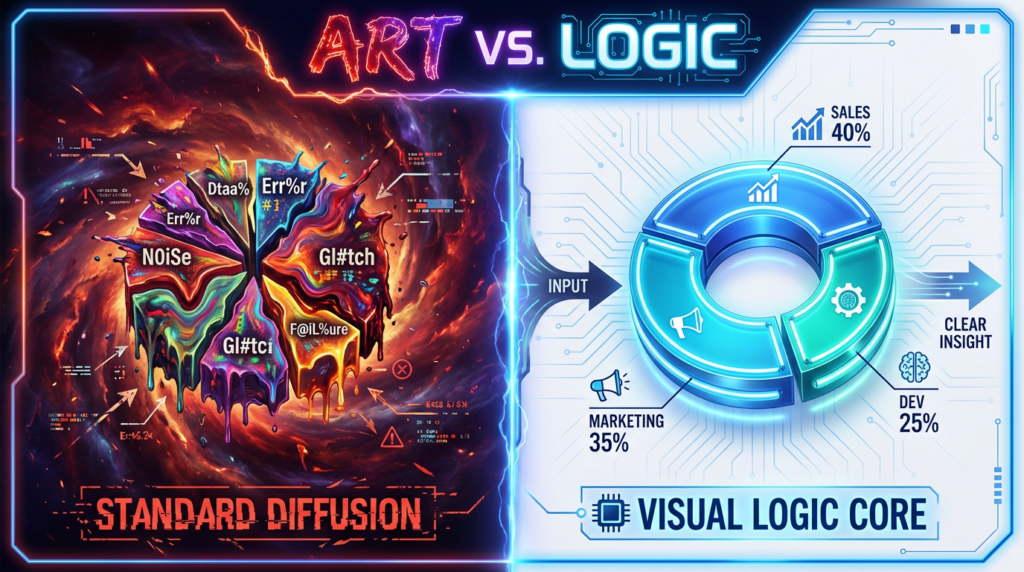
Try asking a standard image generator to create a “Q3 Revenue Growth Infographic.” What did you get? You likely got a stunningly beautiful image of a chart… that made absolutely no sense. The bars were uneven, the text read “Revnuuu 202%,” and the numbers didn’t add up.
For a Marketing Director or a Data Analyst, these images were useless. In the business context, accuracy is not optional; it is the currency. A beautiful chart with wrong data isn’t art; it’s a liability.
As we move into 2026, we are witnessing a massive shift in the generative landscape. The hype cycle for “generative art” is cooling, and the era of Logic-First AI Infographic Generators has arrived.
The Failure of “Pixel-Based” Thinking
To understand why a.graphics is different, we have to understand why previous models failed at data visualization.
Traditional diffusion models treat an infographic the same way they treat a painting of a sunset: as a collection of pixels and textures. They don’t understand that a “pie chart” implies a mathematical relationship where the slices must equal 100%. They don’t understand that a “timeline” requires chronological order.
They are hallucinating aesthetics, not rendering logic.
This is why millions of professionals stuck to manual tools like Canva or PowerPoint. They needed control. They needed to know that if they typed “25%,” the image would actually show “25%.”
Enter the “Visual Logic Core™”: A New Engine for Design
This is where the next generation of tools comes in. Platforms like a.graphics have moved beyond simple text-to-image prompting. We utilize what we call a Visual Logic Core™.
Instead of guessing pixels, our engine performs a “Reasoning Step” before a single line is drawn.
- Semantic Analysis: It understands that “Compare A and B” requires a split-screen layout or a comparison table.
- Data Structuring: It organizes your raw text into a hierarchy (Headline -> Subheader -> Data Points).
- Precision Rendering: It locks the text pixels to ensure perfect spelling, effectively solving the “AI gibberish” problem.
This isn’t just an upgrade; it’s a category definition. It transforms the tool from an “AI Toy” into a Enterprise-Grade AI Infographic Generator.
The ROI of “Subscription-Based” Design
In the SaaS and Agency world, speed is everything. Traditionally, creating a high-quality infographic for a blog post or a pitch deck involved:
- Cost: Hiring a freelancer (200-500 per image).
- Time: Waiting 2-3 days for revisions.
- Effort: Manually dragging shapes in design software.
With a subscription-based AI model like a.graphics Pro, the unit economics collapse. Because it creates unlimited visuals for a flat monthly fee, an infographic becomes a disposable, high-velocity asset. You can generate ten variations of a “Market Share Analysis” in the time it takes to write an email to a designer.
This “High-Velocity Visuals” strategy is how modern content teams are dominating search results. Google loves rich media. By embedding unique, data-rich infographics in every post, you drastically increase time-on-page and backlink potential.
Why “Search Grounding” is the Killer Feature
The final piece of the puzzle is Context. A pretty chart is useless if the data is from 2021. The newest AI infographic generators are now connected to the live web.
At a.graphics, we integrated Real-Time Search Grounding. You don’t even need to provide the data. You can simply prompt: “Create an infographic showing the current stock performance of NVIDIA vs. AMD.”
The Logic Core fetches the live data, verifies it, and renders the chart. This collapses the workflow of Research -> Draft -> Design into a single click.
Conclusion: The Future is Semantic Design
We are moving away from “Prompt Engineering” (trying to trick a model into drawing hands correctly) toward “Data Engineering” (feeding clean logic into a smart engine).
For businesses, this means the barrier to professional design has effectively vanished. The question is no longer “Can we afford an infographic for this post?” but “Why doesn’t this post have an infographic?”
Ready to upgrade your visual workflow? Stop fighting with hallucinations. Start designing with logic. Explore the a.graphics Logic Engine